The register tally for the week of September 22 to 28, 2026 puts DC at 41.29% ahead of Marvel at 28.62% and Image at 19.07%, with six DC titles in the top 10. This number measures one very precise thing: what went through the register, over seven days, in more than 600 equipped specialty stores using point-of-sale software that feeds the tally. It measures neither a month, nor a year, nor general bookstores, nor digital, nor secondhand, nor Europe. To the question "what is DC's annual market share in 2026", there is no public answer: distribution reports stopped being published in 2022 and nothing has replaced them. Read for what it is, this tally nonetheless remains one of the few useful signals of the moment.
Every week, the same percentage circulates and every week it is miscopied. A register tally comes out, it gives a publisher at forty-one percent, and the sentence that comes out of it becomes "DC holds 41% of the market". In between, five restrictions disappeared along the way, and any one of them would be enough to change the conclusion.
This is not a specialist's detail. A collector who thinks they are reading an annual market share draws wrong conclusions about a publisher's health, about an issue's future scarcity, sometimes about when to buy. Whereas a collector who knows exactly what the tally counts finds real information in it, modest but usable, that almost nobody goes looking for.
This article therefore does not comment on the week's ranking. It takes the instrument apart: what it measures, how it is made, the four places where the reading slips, and what can legitimately be drawn from it. For the broader question of the break in distribution data since 2022 and what a growing market for new comics changes for the secondhand market, the feature on the direct market's rise covers the subject from end to end: it is the natural complement to this page, which sticks to the weekly tool.
What the September 22 to 28, 2026 tally says, word for word
Let us start with the complete statement, without shortcuts. Over the week from September 22 to 28, 2026, in more than 600 specialty stores whose registers feed the tally, the breakdown by publisher stands as follows: DC at 41.29%, Marvel at 28.62%, Image at 19.07%, IDW at 2.99%, Titan at 1.98%, Boom at 1.81%, Mad Cave at 1.19%, Dark Horse at 1.09%, Ignition at 1.02% and Oni at 0.95%.
The top of the ranking by title, for the same week, lines up Absolute Batman #24, Absolute Wonder Woman #24, Muppets Take the Marvel Universe #1, Infernal Hulk Vs Wolverine #1 and Absolute Flash #19. Six DC titles are in the first ten places.
That is the statement. Note what it already contains: a seven-day period, a pool of stores, a category of commerce. And note what it does not contain: no number of copies, no amount, no comparison with the previous week, no indication of what this week weighs in the month. Everything people often think they read in it is added by the reader.
The five restrictions contained in the title
Each word of the title is a closed door. Here are the five, in the order in which they cost the most when forgotten.
One week. Not a month, not a quarter, not a year. Seven calendar days, chosen by the arbitrariness of release dates rather than by accounting logic. It is the heaviest restriction and the one most often erased.
Equipped stores. The tally aggregates the registers of shops that use one of the two management software packages feeding the measurement. That is more than 600 points of sale, which is a lot for this sector, but it is not the entire worldwide specialty network, and these stores did not end up in it by random draw.
Specialty stores. General bookstores, the culture aisles of big-box stores, toy chains that sometimes sell single issues, online platforms selling new comics: none of that is in the perimeter. Yet the general bookstore channel weighs heavily in comics sales by business volume, mainly as collected editions.
New single issues. The tally looks at the new release coming out this week and titles still on the shelf. It does not look at the same store's secondhand bins, nor private sales, nor public auctions, nor anything that makes up the market where a collector of old issues spends most of their time.
A price set by the publisher. As soon as a share is calculated in value, it is calculated on a rate decided upstream, identical in all stores. That rate has no relation to what a copy will be worth secondhand, and it varies from one publisher to another: a 40-page issue at $5.99, like those of the Midnight Universe line launched by Marvel in October 2026, does not weigh the same in a value share as a comic at the standard rate, whereas it counts as one unit in a volume share.
A week is not a year: the calendar manufactures the ranking
Here is the mechanism that almost all repostings of these numbers ignore. In a weekly tally of new releases, what determines the ranking is not first the popularity of the titles, it is the date on which the publisher decided to release them.
The week of September 22 to 28, 2026 illustrates it perfectly. Three of the top five places are held by issues of the same editorial line, and six titles from the same publisher fill the top 10. That does not mean one publisher produced six more desirable titles than all the others. It first means it released six that week. A line that comes out bunched mechanically crushes a competitor that spreads out its releases.
The same reasoning works in the other direction, and that is where it becomes useful. Absolute Batman, which its writer describes as selling close to 500,000 copies a month, stops after #25 on October 28, 2026. The series does not appear in December 2026, makes way for Beyond Ark M in November and a special issue in January 2027, then resumes at #27 in February 2027. In the weeks without this title, the tally will lose a locomotive, and its publisher's share will drop. Concluding from that drop that a publisher is "losing ground" would be exactly the mistake these numbers invite you to make.
Hence a simple rule: a weekly tally is always read with the week's release calendar next to it. Without it, you attribute to demand what belongs to planning. And since each week has its own calendar, comparing two consecutive weeks without taking into account what came out in each produces no information.
Copies or revenue: two rankings for the same week
A second point of caution, less intuitive. A breakdown percentage by publisher can be calculated in two ways, and the two give different results on the same sales.
By volume, you count copies. Each comic is worth one, whether sold at two dollars or eight. By value, you add up the amounts collected. A publisher that publishes few but expensive titles can then overtake a publisher that publishes many at a moderate price, without having sold more copies.
The practical consequence is important: before interpreting a gap of two or three points between two publishers, you need to know which of the two quantities you are looking at. And you cannot convert one into the other from the percentage alone, because that would require knowing the breakdown of prices and quantities inside each share, which the tally does not publish. A number like 41.29% must therefore always be tied to its definition, which has to be read in the source itself and not guessed.
The same remark applies to the tiers at the bottom of the table. Between Ignition at 1.02% and Oni at 0.95%, the gap represents a few hundred copies on a sample of 600 stores over seven days. The chance of a release date or a store missing from the tally that week is enough to swap the two lines. Small gaps, at the bottom of a weekly table, are not information.
A sample of equipped stores, not a census
Third point. More than 600 stores is a respectable pool, and that needs saying before criticizing its limits: it is today one of the very few regular public sources on this trade. But a sample is not a census, and this one is not constituted at random.
To appear in the tally, a store must use one of the management software packages that feed it. That introduces a discreet selection: computerized shops subscribed to a modern management tool are not the exact copy of the whole network. They are on average more structured, often bigger, and their clientele does not necessarily have the same habits as that of a shop run from a notebook.
None of these remarks disqualifies the measurement. They only say how to use it: as a trend indicator on an identified subset, not as a census of the market. The difference becomes visible as soon as you try to extrapolate. Multiplying a share observed on 600 stores to deduce a worldwide total assumes that these 600 stores resemble all the others, which nothing guarantees.
Three wrong readings of the same line
The most effective way to fix all this is to take a single line of the tally and see what can and cannot be said about it.
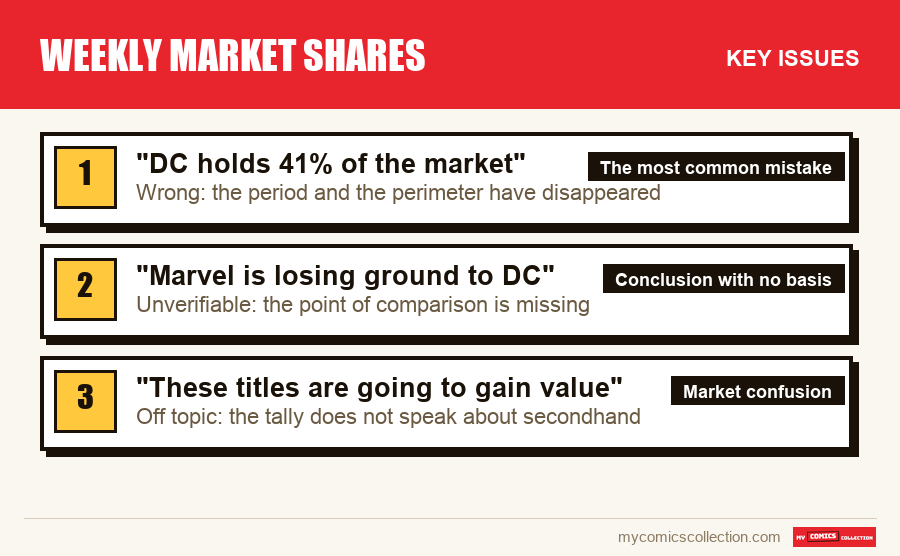
"DC holds 41% of the market"
The correct sentence is: over the week tallied, in equipped specialty stores, this publisher accounts for 41.29% of the tally. Removing "over the week tallied" turns a seven-day observation into a structural claim. Removing "in equipped specialty stores" annexes along the way general bookstores, digital and all distribution outside specialists, which are not measured here.
"Marvel is losing ground to DC"
A single tally contains no evolution. To speak of a decline, you would need a series of comparable weeks, and above all neutralize the effect of the release calendar, since the week observed sees several bunched titles from the same publisher come out. Without that correction, you are measuring a schedule, not a dynamic.
"These titles are going to gain value"
The tally records sales of new releases at the publisher's rate. A copy's price is formed elsewhere, on a stock of already printed copies, at negotiated prices. A title that sells heavily in its release week then circulates in large quantity, which rather works against its future scarcity. The full mechanism is detailed in the guide to print runs and in the method to estimate an issue's real scarcity.
Why "DC's annual market share in 2026" has no public answer
Many readers are actually looking for something other than the weekly tally. They want the figure for the year. It must be said clearly that it does not exist, and why.
Until the early 2020s, a monthly and annual tally of shipments to North American specialty stores was published by the historic distributor. It stopped: that distributor ceased its monthly publications in 2022, and none of its successors has taken up the exercise. The last years documented by distribution therefore end before this break, and nothing has taken over in comparable form.
The scope of this needs to be measured. It means there is no monthly market share for 2026, no annual share for 2026, no official ranking of publishers for the year, and no known printed quantity title by title either. Issue-by-issue print run estimates depended precisely on the vanished reports. When a source puts forward an annual percentage for 2026, it reconstructs it through a calculation whose method you must demand.
The weekly register tally is not the replacement for this lost data. It measures something else, at another point in the chain, over another period, from another sample. It is a different instrument, not an abridged version of the old one. The market reviews of the year 2025 show well what remains and in what form: revenue estimates by channel, not shares by publisher.
When the tally underestimates a success: the case of sell-outs
One last phenomenon skews the reading, and it is counterintuitive: a weekly tally underestimates the very big successes, because a store can only sell what it has received.
The year 2026 offers several examples. Amazing Spider-Man #1000, released on September 30, 2026 at 104 pages with a main story by Joe Kelly and Pepe Larraz, exceeded 400,000 preorders, sold out on its very release day, and a second printing was already scheduled. Unfilled orders were announced for November 4, 2026, and nine covers were put back to press. In other words, this issue's sales will appear spread over several weeks of tallies, some very far from the release date.
The same pattern repeats elsewhere. Absolute Green Arrow sold out a week before its release. Mind MGMT: New & Improved #1 and The Exorcism at Buckingham Palace #1 sold out at the distributor before even reaching stores. Terminal #1, printed at 300,000 copies where 100,000 had been hoped for, received a second printing on August 26, 2026.
What this means for reading a tally: the line of a sold-out title measures the stock available in the sample's stores, not demand. The gap between the two can be considerable, and it is partly made up weeks later, which artificially inflates a later week where no major release came out. It is, paradoxically, the most interesting information in the tally for a collector: a repeated sell-out is a signal of tension on supply, and that is precisely what the week's percentage does not show.
Reading a weekly tally in six gestures
Here is the procedure I apply to each publication. It takes three minutes and avoids all the mistakes described above.
Note the exact period
Note the start and end dates, here September 22 and 28, 2026. Write them next to the percentage and never separate them again. Any reasoning that does not mention them is suspect.
Identify the perimeter
What type of commerce, how many establishments, which country. If the source does not say, do not use it. A percentage with no perimeter is not data, it is an impression.
Check whether copies or amounts are counted
Look for the mention in the source. Both readings exist and they do not rank publishers in the same order. Absent explicit indication, limit yourself to noting a broad hierarchy rather than a precise gap.
Open the week's calendar
List what came out during those seven days. If an editorial line released several bunched titles, you have the explanation for the top of the table, and you know the following week will be different without any trend having moved.
Spot sell-outs and second printings
A title sold out before or on its release day appears under its real size, and will reappear later. That is the signal to keep, far more than the percentage itself.
Conclude nothing about your own copies
The tally contains no information on secondhand value. If your question is what you own is worth, it is an inventory you should open, not a ranking of new sales. The estimate based on your list answers that question, the tally never does.
What the collector can still draw from it
After so many reservations, the temptation would be to throw out the instrument. That would be a shame, because it brings three things that no other regular public source gives today.
First, a relative hierarchy over time. A single tally is worth nothing, but a reading habit over several months draws something real: which publishers durably occupy the top of the specialty stores' basket, which newcomers settle into the table, which disappear. The regular presence of publishers that did not exist ten years ago is structural information, not a weekly accident.
Next, a spotting of supply tensions. Sell-outs, second printings, unfilled orders are the most concrete facts of 2026, and they are read in the margin of the tally more than in it. For a collector who buys new in a shop, knowing that an issue sells out before release is immediately actionable information, unlike a percentage.
Finally, a test of your own buying behavior. If a weekly chart makes you want to buy a title whose series you do not follow, the tally has just taught you something about yourself, not about the market. The springs of this reflex are described in the analysis of the signs of a speculative bubble, and the question of the format it often translates into, single issue or collection, is covered in the comparison between omnibus and original issues.
For the French-language reader, one last precaution is in order. This tally describes a network of North American stores. It says nothing about the French market, its volumes or its calendar, and the series it talks about arrive here later, most often as collected editions. The aspects specific to buying from France are gathered in the guide to buying and selling comics in France.