The print run is the exact number of copies printed of a given comic. Vintage Marvel/DC Bronze Age issues (1970-1985) ran between 200,000 and 500,000 copies per issue. Today's Big 2 titles top out at 30,000 to 80,000. Independents range from 5,000 to 30,000. Public sources: Diamond Distributor monthly data, Comichron for historical figures. Survival rates drop from 60-80% for modern books to just 1-5% for Golden Age.
A comic's print run, the number of physical copies produced, is fundamental to understanding scarcity and market value. Yet few collectors actually know how to read Diamond or Comichron figures, or what it means when a print run clocks in at 42,000 versus 480,000. This 1,850-word guide covers print run benchmarks by era (Golden, Silver, Bronze, Modern, and contemporary), the public sources available to look them up, how the retailer ordering model drives those numbers, the key concept of survival rate that can turn a large print run into a relative rarity, and what all of this means for market pricing in 2026. By the end, you'll be able to judge whether a $220 vintage comic is overpriced or a steal based on its original print run and statistical survival rate.
What "Print Run" Actually Means
The print run is the total number of physical copies printed and distributed by the publisher at a comic's initial release. The figure excludes subsequent printings (second print, third print, facsimile editions), which are tracked separately. For a modern comic, the print run breaks down across several channels: direct market (comic shops via Diamond, or Penguin Random House since 2021), newsstand (convenience stores, supermarkets, drugstores), ratio cover variants (1:25, 1:50, 1:100, 1:500), retailer incentives, convention exclusives, and store variants.
Publishers don't set their own print runs unilaterally. The dominant model since 1980 is the retailer ordering system: Diamond Distributor (or Penguin Random House since Marvel and DC's departures in 2020-2021) releases a Previews catalog three months ahead of release. Comic shops worldwide place firm orders. The publisher tallies the orders, adds a 5-15% buffer for printing errors and newsstand, then goes to press. This is why a modern comic anticipated to underperform (say, a failed 2023 relaunch) might only print 12,000 copies, while a major Marvel event like Secret Wars surpasses 250,000 on its first issue.
The data is partially public. Since the 1990s, Diamond has published a monthly Top 300 ranking of direct market sales, with exact figures for ranks 1 through 100, and indexed estimates (relative to #100) for ranks 101 through 300. Comichron, a specialist site run by John Jackson Miller, has aggregated that data since 1997 and partially reconstructs pre-1997 figures. For long-term collection tracking with this metadata, the comic collection app integrates estimated print runs for key issues.
Print Run Benchmarks by Era
Print run figures vary enormously across eras, which is exactly why a vintage comic with a 300,000-copy print run can be scarcer today than a modern book with 30,000 copies. The difference comes down to survival rate: covered below.
Golden Age (1938-1955)
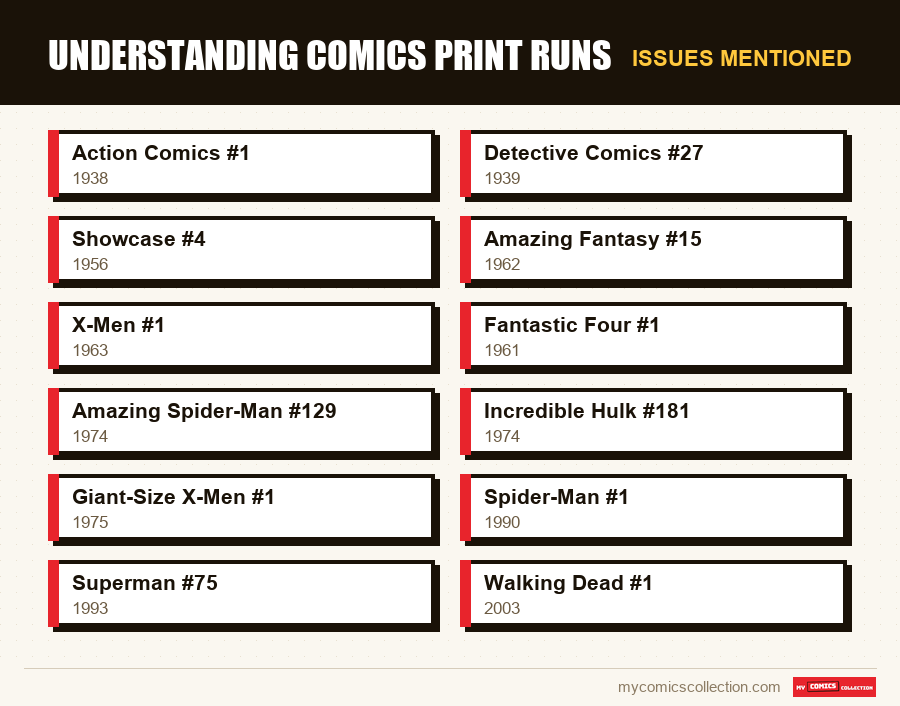
Exact Golden Age figures are incomplete, but orders of magnitude are well documented. Action Comics #1 (June 1938), the first Superman, printed around 200,000 copies. Detective Comics #27 (May 1939), the first Batman, roughly 200,000-250,000. At the Golden Age's peak, around 1944-1947, flagship titles from Dell, Fawcett, and DC exceeded one million copies per issue: Captain Marvel Adventures peaked at 1.3 million monthly; Walt Disney's Comics & Stories surpassed 3 million. The mass-market comic industry accounted for up to 80 million copies per month in the United States in 1953, before the post-Code collapse.
Silver Age (1956-1970)
The Silver Age opens with Showcase #4 (October 1956) and the return of the Flash. Typical Marvel/DC print runs fell between 200,000 and 400,000 copies per issue. Amazing Fantasy #15 (August 1962), Spider-Man's debut, printed approximately 250,000 copies. X-Men #1 (September 1963), around 200,000. Fantastic Four #1 (November 1961), 200,000-220,000. High-volume titles like Archie or Dell licensed comics still exceeded 500,000 copies, but DC and Marvel superhero books stayed in that bracket.
Bronze Age (1970-1985)
The Bronze Age maintained high print runs despite the gradual decline of newsstand distribution. Amazing Spider-Man #129 (February 1974), the Punisher's first appearance, printed between 280,000 and 320,000 copies. Incredible Hulk #181 (November 1974), Wolverine's first full appearance, around 240,000-280,000. Giant-Size X-Men #1 (May 1975), the All-New All-Different lineup, 230,000-260,000. Numbers declined toward the end of the period: an average Marvel comic from 1984 printed around 150,000-200,000 copies, down from 350,000 in 1972.
Modern Age (1985-2000)
The Modern Age is defined by the speculative bubble of 1991-1993. X-Men #1 (October 1991, Jim Lee), across its five variant covers, reached a combined print run of 8.1 million copies: an all-time world record. Spider-Man #1 (1990, McFarlane) hit 2.5 million. Superman #75 (January 1993, Death of Superman) reached 6 million. After the bubble burst, print runs cratered: an average Marvel comic in 1996 printed 70,000-100,000 copies. By the late 1990s, newsstand distribution had all but vanished.
Contemporary (2000-2026)
Modern figures are the best documented. A standard Big 2 (Marvel or DC) title prints between 30,000 and 80,000 copies today. Batman during Tom King's run exceeded 100,000 on early issues (2016), then cruised at 60,000-70,000. Amazing Spider-Man under Nick Spencer (2018) ran at 80,000-90,000 per issue. Image, Boom!, and Dark Horse independents typically land between 5,000 and 30,000 per standard issue. The Walking Dead #1 (October 2003) printed only 7,200 copies on its first run: which explains its current CGC 9.8 value of $2,700-$5,500.
Public Sources for Verifying Print Runs
Three main sources let you track down a print run with varying degrees of reliability. None is perfect, but cross-referencing them gives a workable estimate for buying and pricing decisions.
Diamond Distributor Top 300. Since the 1990s, Diamond has published an exact monthly ranking of the top 100 comics sold in the direct market, plus indexed estimates for ranks 101-300. Marvel shifted to Penguin Random House in March 2020; DC followed in June 2020. Since then, Diamond only covers Image, Dark Horse, IDW, Boom!, and independent publishers. The monthly Top 300 remains available on Diamond's official site.
Comichron. John Jackson Miller's Comichron site aggregates Diamond data from 1997 onward and partially reconstructs figures from 1991-1996 using Capital City Distribution rankings and industry archives. Comichron also provides annual analyses, publisher trend curves, and estimates for Penguin Random House releases since 2020. It's the academic gold standard for US market data.
ICV2 and League of Comic Geeks. ICV2 has published quarterly and annual market analyses since 2001, with total estimates across direct market, newsstand, and book channels. League of Comic Geeks integrates Diamond and Comichron data into its community catalog, available free after registration.
For pre-1991 comics, precise figures are rare. Marvel and DC occasionally published their Statement of Ownership inside specific issues (a legal US requirement to qualify for preferential postal rates). These statements listed the average print run over 12 months and the most recent issue's print run: they are the primary source for Silver and Bronze Age numbers. The Mile High and Pacific Coast pedigree guide explains how pedigree collections cross-reference print run data to estimate absolute scarcity.
How the Retailer Ordering System Works
The print run of a modern comic isn't decided by the publisher alone. It's the result of a firm-order cycle driven by the distributor. The cycle runs three months and works like this: in early January, Marvel publishes its April catalog in Previews. Retailers review the catalog, forecast demand, and place FOC (Final Order Cutoff) orders three to six weeks before release. By mid-March, Marvel totals all worldwide orders, adds a safety margin (5-15% depending on how confident they are in the title), and goes to press. In early April, the comic arrives at comic shops.
This system explains several market realities. First, ratio variants: a retailer that orders 25 copies of the standard cover receives one copy of the 1:25 variant for free. The more rare variants a retailer wants, the more standard copies they must order. A 1:100 variant requires 100 standard copies; a 1:500 requires 500. This mechanism artificially inflates the print run of issues with desirable variants. The 1:25 and 1:100 ratio variants explained guide covers this in full detail.
Second, signature stunts: for a major event (series relaunch, anticipated key issue), publishers encourage retailers to over-order via incentives. The result: Marvel's Star Wars #1 in January 2015 printed 1.07 million copies on first print, while the same series cruised at 200,000 on subsequent issues. These event over-prints explain why a #1 is frequently less scarce than issues #5 or #10 of the same run, even if the #1 commands higher prices due to first appearances.
Third, there are no returnables in the direct market. All orders are firm and non-returnable. This rule, established by Phil Seuling in the 1970s, shaped the entire modern system. It pushes retailers to order conservatively, which creates natural scarcity on sleeper issues like The Walking Dead #1 or Saga #1.
Survival Rate: The Real Variable
A raw print run figure doesn't say much without its essential counterpart: the survival rate. How many copies still exist today in acceptable condition (Fine or better)? Academic and market estimates converge on the following ranges.
Golden Age (1938-1955): 1 to 5%. Of the roughly 200,000 copies of Action Comics #1, an estimated 100 survive in Fair condition or better: a survival rate of about 0.05%. For standard Golden Age titles, the figure is 1 to 5%. Contributing factors: acidic paper that crumbles, no collector culture before 1960, paper recycling during WWII shortages, parents throwing out kids' comics, and heavy reading that destroyed copies.
Silver Age (1956-1970): 10 to 20%. Of the roughly 250,000 copies of Amazing Fantasy #15, an estimated 25,000 to 50,000 survive in Fair condition or better. Of those, about 8,000 are CGC-graded, with roughly fifty at 9.4 or above. That scarcity at the top of the grade ladder is what puts an AF #15 in CGC 9.6 at $3.6 million in a Heritage public auction.
Bronze Age (1970-1985): 30 to 50%. Collectors became more systematic; comic shops appeared (the first in 1968, with a structured market by 1973); bagging and boarding became common practice around 1980. Hulk #181, printed at roughly 250,000 copies, has an estimated 100,000 still readable today, with around 25,000 CGC-graded.
Modern Age (1985-2000): 50 to 70%. Bagging and boarding was widespread; the late 1980s speculative market meant many copies were preserved in fine condition but often ungraded. High survival rates explain why the vast majority of 1990-1995 comics are worth only $1-$5 despite iconic covers.
Contemporary (2000-2026): 60 to 80%. Nearly all copies flow through the direct market to comic shops and collectors. Newsstand was almost gone by 2013 (Marvel's last meaningful presence). The high-grade survival rate is very elevated, which hurts long-term value. Exceptions are low-print-run independents (Image, Boom!) that combine small initial pressings with heavy reading (fans actually read their comics), creating real CGC 9.8 scarcity.
Real-World Implications for Market Value
Print run and survival rate determine absolute scarcity, but market value also depends on demand. Three typical scenarios illustrate the market dynamics at play in 2026.
Case 1: Large print run + strong demand + low high-grade survival. Amazing Spider-Man #300 (May 1988), Venom's first full appearance. Estimated print run: 350,000 copies. Survival rate: 60%, but CGC 9.8 survival under 1% due to fragile white pages and print quality issues. Result: raw copies at $110-$275; CGC 9.4 at $440-$660; CGC 9.8 at $2,000-$2,750. The scarcity is at the grade level, not the copy level.
Case 2: Small print run + strong demand + good survival rate. The Walking Dead #1 (October 2003), the first issue of Kirkman's series. Print run: 7,200. Survival rate: ~70%, as it's an indie comic that early adopters treated with care. Result: roughly 5,000 copies exist, about 1,200 are CGC-graded, with around 200 in CGC 9.8. Raw value: $880-$1,320; CGC 9.8: $3,850-$6,050. Absolute scarcity.
Case 3: Large print run + weak demand. X-Men #1 (1991, Jim Lee). Combined print run across all covers: 8.1 million copies. Survival rate: ~75%. Over 6 million copies still exist, with roughly 100,000 graded. Moderate demand, since the issue is ubiquitous in every collection. Raw value: $5-$15; CGC 9.8: $88-$165. No scarcity whatsoever.
FAQ: Comic Print Runs Explained
How do I find the exact print run of a modern comic?
Check the Diamond Top 300 for the month of release for Image, Dark Horse, IDW, Boom!, and independent titles. For Marvel (since April 2020) and DC (since July 2020), exact figures are no longer publicly released following their moves to Penguin Random House. Comichron publishes estimates based on market indices and official announcements for those publishers.
Why are Golden Age comics so scarce despite their large print runs?
Golden Age survival rates are only 1 to 5%. Of 200,000 copies printed between 1938 and 1955, roughly 2,000 to 10,000 survive in any condition, and often fewer than 100 in collector grade. Culprits include acidic paper, wartime paper recycling drives, no collector culture before 1960, and family purges of comics collections throughout the 1950s-1970s.
Does a 30,000-copy comic automatically mean it's rare?
Not necessarily. A modern 30,000-copy comic with a 75% survival rate leaves roughly 22,500 copies on the market, with 5,000 to 8,000 in near-mint condition. True scarcity only kicks in below 10,000 initial copies, or when exceptional demand drains the available supply.
How do I read a Statement of Ownership in an old comic?
Marvel and DC were required to publish a Statement of Ownership in one fall issue of each series annually, listing the average print run over 12 months and the most recent issue's print run. This US postal regulation compliance document is the only official source for Silver and Bronze Age print figures. Look for it in the editorial pages of autumn issues.
Does the second print count toward the total print run?
No: by market convention, the print run refers to the first print only. Second prints are tracked separately and valued differently: a Walking Dead #1 second print from 2004 is worth $55-$165, versus $880-$1,320 for the first print. Modern Marvel and DC facsimile editions do not count toward the original print run either.
Why do indie Image comics often command higher prices than Marvel/DC?
Low-print-run Image books combine three rare factors: a small initial pressing (5,000 to 15,000 copies), strong demand if the title goes viral, and heavy reading that destroys unprotected copies. Walking Dead #1, Saga #1, and Invincible #1 all illustrate this dynamic, with values 50 to 200 times their cover price.
What does a "1:25 ratio variant" actually mean in terms of print run?
A 1:25 variant means a retailer receives one copy of that variant for every 25 standard copies ordered. If the standard print run is 50,000 copies, the 1:25 variant totals approximately 2,000 copies. A 1:100 variant in the same context prints to around 500 copies: which explains values running 5 to 20 times higher than the standard edition.
Can I look up a comic's print run from France?
Yes, for US comics: Comichron and Diamond are freely accessible online from anywhere in the world. For French comics (Delcourt, Glénat, Urban Comics, Panini France), precise figures are almost never published. The SNE and SoFIA reports provide aggregate estimates by segment, but not by individual title.
Related Articles
- Most Expensive Comics in 2026: Top 30 Values
- Understanding Mile High and Pacific Coast Pedigrees
- Comic Ages Explained: Golden, Silver, Bronze, Modern
- How Comic Prices Have Evolved: 1970-2026
- Variant Covers: A Complete Guide
- Ratio Variants 1:25 and 1:100 Explained
- Undervalued Comics in 2026: Sleeper Issues to Watch
- Amazing Spider-Man Key Issues