The 5 to 10% per year range attributed to the most established comics is not backed by any published method that we have been able to find. The only public indicators available as of October 1st, 2026 tell a different story: over calendar year 2025, four of the six baskets tracked by a pricing data provider fell, from -1.23% to -6.66%, while the modern basket gained 2.36%. Over the following twelve months, the same modern basket showed 18 to 20%. Neither of those two years looks like "5 to 10%". And before talking about gains, you have to subtract very real fees: certifying a piece with no value cap costs 4% of its market value, and a selling commission of 13 to 15% eats up two to three years of supposed appreciation.
There is a sentence every collector has read at least once, in French as in English, and it has the elegance of never citing its source: the market's big pieces appreciate 5 to 10% per year. It is a well-built sentence. It is modest enough to sound serious, wide enough never to be contradicted, and round enough to be remembered. It underpins many buying decisions.
This article does not try to demolish it or confirm it. It tries to do something more useful: show what such a number is made of. Because once you have seen how an annual appreciation figure is calculated on a market of unique objects, you never read a percentage the same way again. And you stop asking whether the number is true, and start asking what it measures.
We tried to source the range. We did not succeed: no accessible publication claims it with a method, a scope and a period. What follows therefore starts from the data we were actually able to read, and confronts the sentence with it.
First question: what do we mean by "blue chip key"?
The expression blue chip does not come from finance but from poker. In the simplest chip games, white, red and blue, the American tradition holds that blue is the strongest. The word is attested as a noun as early as 1873, as an adjective in 1894, and its application to stocks goes back, according to the in-house tradition of an American financial publisher, to an employee in the 1920s who watched big trades go by on the ticker and announced he would write about these "blue chip stocks".
This detour is not ornament. The classic financial definition of a blue chip says nothing about price: it designates the stock of a company with a national reputation for quality and reliability, able to turn a profit in good times and bad. What qualifies a blue chip, originally, is consistency across cycles. Not expensiveness.
Transpose that to comics. A collectible turns no profit. It produces nothing, pays nothing, and does not go through cycles other than by suffering their effect on the price someone is willing to pay. The central property of the original definition disappears in translation. All that remains is the intuition: "it's a big piece, it should hold".
And that is where the definition becomes decisive, because there is none that carries authority. Everyone draws their own boundary:
- by age, reserving the expression for comics from before 1956 or before 1970;
- by certified scarcity, relying on the number of copies recorded in a given grade;
- by character fame, which lets 1980s comics in and leaves pre-war rarities with no known character out;
- by entry ticket, that is, by price itself, which makes the reasoning circular: the piece is top-tier because it is expensive, and it is expensive because it is top-tier.
In practice, the only working definition of a market is the one an index calculation imposes. And there, the scope is narrower than people ever suspect. The highest-end basket we were able to consult as of October 1st, 2026 rests on 34 comics, documented by 28,540 sales accumulated since its creation. The baskets by era have about fifty each. In other words: when a publication announces the appreciation of "blue chip keys", it is announcing the average movement of a few dozen references chosen in advance.
That is not a criticism. An index has no other way to exist. But it means a sentence like "keys appreciate 5 to 10%" is not a measure of the market: it is a measure of a list. Change the list, change the number. Our article on the so-called blue chip strategy details the possible selection criteria; the point here is just to remember that the choice comes before the measurement.
How do you build an annual appreciation figure for unique objects?
A stock index has it easy: the security is fungible, share A is worth exactly share B, and quotation is continuous. Nothing like that here. Two copies of the same comic, printed on the same day on the same press, have neither the same condition, nor the same centering, nor the same page whiteness, nor the same history. So there is no "price" of a comic. There are prices of copies.
To draw a curve from that, a data provider proceeds by successive approximation. The method publicly described in September 2026 fits on one line: the index relies on sales of CGC-certified copies with a standard label, split into grade bands, with observation windows adapted to the particularities of each era. Each of those four choices introduces an effect you need to know about.
Only certified sales enter the calculation
The uncertified copy, the one that changes hands at conventions, in shops, from collector to collector, does not exist for the index. Yet it is by far the majority of transactions. The index does not measure the comics market: it measures the market for certified comics, which is a richer, more liquid and more speculative segment than the whole. On some references, we have already documented the near-disappearance of the raw market in favor of the certified one; on many others, it is the opposite.
Only recorded sales enter the calculation
Even among certified copies, only sales whose price is visible and collectable are retained. A private transfer, a trade, an over-the-counter sale between two collectors feeds nothing. The very big pieces are often negotiated precisely this way, which creates a blind spot exactly at the top of the market, the part whose appreciation we claim to measure.
Grades are grouped into bands
You have to aggregate, otherwise each grade of each reference would form a series too thin to mean anything. But grouping means mixing objects whose prices do not move together. Two neighboring grades can behave in opposite ways, and at the same grade, visual appeal moves the price by amounts that often exceed the annual appreciation being sought.
The observation window is a parameter, not a data point
To smooth out noise, you calculate over a rolling period. The longer the window, the smoother the curve, and the later it reacts. The shorter it is, the more nervous it is. Two honest indices, built on the same sales with different windows, show different annual appreciation. That is not a flaw: it is a convention. The problem begins when the convention is not published alongside the number.
Add one last bias, the toughest one, selection: the components of a basket are chosen today, knowing their past. References that collapsed or no longer have a market naturally drop out of attention, even though they are the ones that would have pulled the average down. A list of big pieces is, by construction, a list of survivors.
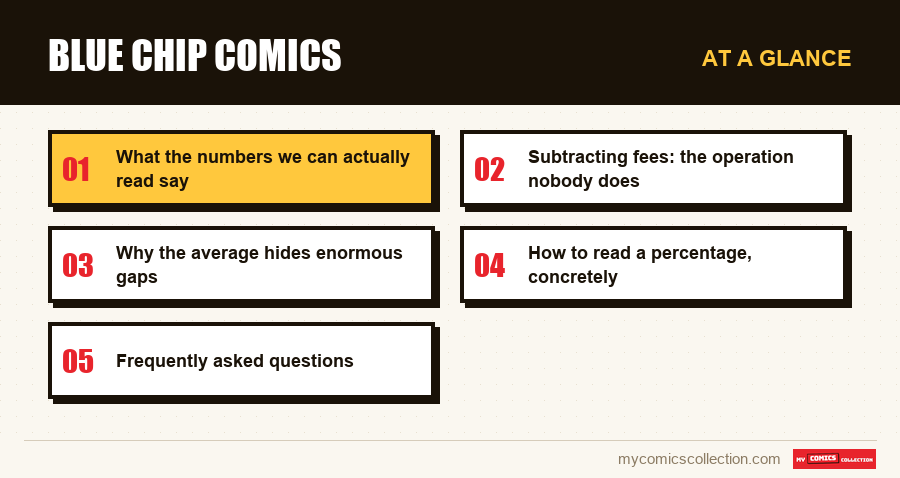
What the numbers we can actually read say
Let us now confront the sentence with the only public data we were able to consult. A pricing data provider publishes several baskets by era and takes stock of them each year. Here is what calendar year 2025 looked like, published in January 2026:
Calendar year 2025, six baskets
Modern basket: +2.36%, the best performance of the year. Pre-war basket: +1.69%. Basket of the biggest pieces: -1.23%. 1984-1991 basket: -5.34%. 1956-1970 basket: -6.18%. 1970-1984 basket: -6.66%, the weakest of all.
The following twelve months, ending in late September 2026, show a very different face. The modern basket showed an appreciation of 18 to 20% over a year, with almost uninterrupted gains. The 1970-1984 and 1984-1991 baskets regained 6 to 7% from their low point. The 1956-1970 basket, starting at around 1,630 points, had dropped to about 1,592 over the winter before climbing back in small weekly steps, so it was roughly flat over the period. The pre-war basket did not rise steadily at all: it advanced in jumps, concentrated in two windows, March-April then May-June.
Put the two years side by side and the conclusion is obvious. In 2025, most baskets lose between 5 and 7%. In 2026, the most volatile of them gains nearly 20%. Neither year produces "5 to 10%". The range does not describe what a year brings: at best, it describes the average you get by stacking enough years that the rises and falls cancel out. That is not the same claim, and the difference is anything but theoretical for anyone considering reselling at a given horizon.
One detail of the 2026 review deserves mention, because it illustrates the fragility of the calculation better than a long discussion. The strength of the pre-war basket is explicitly attributed there to the sales of two named comics. Two. In a basket of about fifty components, some of which see only a few certified sales per year. An index whose annual appreciation hangs on two transactions is not wrong, but it does not measure a trend: it records an event. Our articles on price evolution over ten years and on market phases start from the same observation by other paths.
Subtracting fees: the operation nobody does
Let us now assume the range is exact, even generously exact: 10% per year, every year, on your piece. Let us see what is left.
The rates below are those displayed by CGC as of October 1st, 2026, in dollars, for comics.
The cost of entering the measured market
Since indices only know certified copies, holding a piece "in the market" means having it certified. The bill depends on the declared value:
- comic after 1975, declared value capped at $400: $30 per copy, $45 for expedited processing, $27 from 25 copies;
- comic before 1975, same $400 cap: $45 per copy, $60 expedited, $42 from 25;
- declared value up to $1,000: $105 per copy;
- no value cap: 4% of market value, with a minimum of $135.
Let us dwell on that last line, because it is the one that concerns the pieces said to appreciate 5 to 10%. Four percent of the value. On the low end of the range, that is nearly a full year of appreciation consumed at the moment of certification. On the high end, a little under six months. Add to that a $5 online or $8 paper handling fee, $5 per copy if you want high-resolution photographs, $8 for a custom label, and round-trip shipping of an object that must be insured at its value. The detail of the tiers is covered in our guide to certification services.
A methodological note in passing: these fees are not an argument against certification. It brings real authentication, physical protection and liquidity, and the resale premium it provides can largely cover them. The point is only that they exist, that they are paid in cash, and that they appear in no index.
The cost of exit
This is the heaviest, and the one you discover the day you sell. On a large general marketplace, the selling commission displayed as of October 1st, 2026 ranges, depending on the category, between 13.25% and 15.3% of the total sale amount, shipping included, plus a fixed sum per order. A specialized auction works differently, with a premium charged to the buyer and a commission negotiated with the seller, but the order of magnitude of the total deduction remains comparable.
Do the arithmetic on the most favorable assumption. A piece that appreciates 10% per year must be held a year and a half for the exit commission alone to be covered. At 5% per year, it takes nearly three years. And we have not yet paid anything for entry, or for holding.
The cost of holding
It is less spectacular and more insidious, because it never shows up as a single bill: storage away from light, humidity and temperature swings, preservation supplies to replace, an insurance rider if the value exceeds the limits of an ordinary home policy, and secure shipping of a fragile object on the day of the sale. Taken separately, each of these items is small. Cumulated over ten years, they bite squarely into single-digit appreciation.
The outcome of the full operation is not "so it's a bad idea". The outcome is that the announced range is gross, that it ignores entry, exit and holding, and that a return net of fees over a short horizon can perfectly well be negative while the index is up. Both statements are true at the same time.
The honest comparison: what if you simply kept the object?
There is an amusing asymmetry in this debate. A comic is always compared to an investment, never to the other possible use of the same comic: keeping it, reading it, looking at it, showing it.
Yet that use has a value that appears in no index, for a structural reason: indices only measure copies sealed in a holder. A certified object is by construction an object you no longer read. The measured market is therefore the market of copies whose use has been given up. This is not a criticism of the holder, which protects and authenticates. It is an observation about scope: the index is silent on everything that makes people own comics.
The honest comparison is therefore not "7% a year versus some other investment". It looks more like this. On one side, an object held for its future value, whose return is uncertain, deferred by several years, cut down by the fees we have just itemized, and conditional on finding a buyer at the right time. On the other, the same object held for what it is, with immediate and certain enjoyment, and a resale value that will exist anyway, exactly the same, the day you want or have to part with it.
The second position gives up nothing, except the illusion of control. It also has a measurable practical advantage: it removes the pressure of the horizon. The collector who expects no return has no reason to sell in a year like 2025, when four baskets out of six fell. The one who bought for annual appreciation is precisely the one who ends up forced to sell at the wrong time, because their calendar is not the market's.
And for anyone who still wants to track the value of what they own, the right tool is not a market index but a statement of your own set, reference by reference, grade by grade. That is the whole point of our collection tracking app: it tells you where you stand, not where a list of 34 comics you do not own stands.
Why the average hides enormous gaps
One last point, and probably the most important of all. Even accepting the method, even accepting the scope, an average basket appreciation says very little about what happens to a given comic.
The 2025 review already cited provides the demonstration in its own text. In baskets that moved by a few percentage points, the same year contained individual components at +66% and +79%, and another at -31%. A gap of more than a hundred percentage points between the extremes of a set whose average fit within a point or two. Whoever owned the -31% component lived a year that no average describes.
The same review gives a second dispersion indicator, through levels. At the end of September 2026, the baskets by era stood at 5,136 points for pre-war, 4,863 for modern, 1,621 for 1956-1970, 1,070 for 1970-1984 and 867 for 1984-1991. Same market, same date, same index family, and levels in a ratio of nearly six between the highest and the lowest. The cumulative trajectory therefore depends massively on the segment, not on being a "key".
There is yet another level of dispersion below, often ignored, that of the copy's characteristics. An analysis published in September 2026 on a neighboring market, that of certified magazines, measured the price gap between two distribution variants of the same issue: a ratio of 1.78 at one grade, 4.6 at the next grade up, and 6 to 8 depending on the grade on another issue of the same series. The principle carries over: we have documented this mechanism for the two distribution channels of comics. An attribute you cannot see on a cover weighs more than ten years of average appreciation.
Conclusion of this section, which is also that of the article: an average annual appreciation is information about an aggregate. It does not break down. It is not a promise. And it does not apply to the object sitting on your table.
How to read a percentage, concretely
When you come across an annual appreciation figure, five questions are enough to know whether it is usable. If one remains unanswered, the number is not wrong, it is simply unusable.
What does it cover?
Is there a list of references, and is it published? How many components? On what criteria were they chosen, and on what date was the list fixed? A number with no explicit scope compares to nothing.
Over exactly what period?
A calendar year, twelve rolling months, a ten-year average, an annualized cumulative figure? The two years documented above, 2025 and the twelve months to late September 2026, are enough to show that a shift of a few months changes everything.
Which sales are counted?
Certified only, or raw too? Public auctions, fixed-price online sales, private transfers? How many transactions actually feed the series for the reference you care about, over the period? Three sales in a year do not make a curve.
At what grade?
An appreciation announced with no grade is an appreciation with no object. The high bands and the middle bands of the same reference regularly behave in divergent ways, and our guide to the census of certified copies explains why the relative scarcity of a grade weighs more than the scarcity of the comic.
Gross or net?
In almost all cases, gross. Then apply the arithmetic of the previous section: subtract the exit commission, the certification cost, the holding. What remains is the number that concerns you.
If you would rather work the other way around and estimate the value of an existing set rather than project an appreciation, the approach is different and far more reliable, because it starts from real objects and recent comparable sales. That is also what an estimate based on your own list allows.