
Over 56 years, key issues have multiplied in value by anywhere from 100 to 600,000 times. Action Comics #1 went from $10 in 1970 to $6 million in 2024. Hulk #181 went from $50 in 1990 to $30,000 in 2023 (CGC 9.6). ASM #129 follows the same curve. The gains are not linear: 7-to-10-year cycles are correlated with film and TV adaptations, with a long plateau between 1995 and 2002, an explosion from 2014 to 2021, and a correction from 2022 to 2024. Real inflation (constant 2026 USD) cuts nominal gains by a factor of 7.8.
Comic book price history from 1970 to 2026 tells a three-act story: a niche market confined to fanzines and conventions until 1985, then professionalisation with the rise of Overstreet , CGC in 2000, and eBay in 1995, then a speculative explosion starting in 2014 driven by Marvel Studios. Price curves spanning 56 years reveal repeated 7-to-10-year cycles, correlated with announcements of film or TV adaptations. But the nominal reading is misleading: adjusted for USD inflation, the real returns on the most expensive comics remain impressive (4 to 5% annualized above inflation for key issues), while the vast majority of issues stagnate or lose real value. This data-driven guide breaks down the curves by decade, the film adaptation-price correlations, and the inflation verdict for Action #1, Hulk #181, and ASM #129.
Action Comics #1 (1938): the benchmark curve over 56 years
Action Comics #1, Superman's first appearance, serves as the absolute barometer of the market. Its price curve across six decades is the reference point for measuring the health of the Golden Age segment. The numbers speak for themselves: $10 in 1970 (average price for a copy in fair-to-good condition), $100 in 1980, $1,000 in 1990, $10,000 in 1999, $100,000 in 2010, $1.5 million in 2014 for a CGC 9.0, and $6 million in 2024 for the same CGC 9.0 (Heritage Auctions sale, April 2024).
This 600,000× multiplier over 56 years conceals a more complex reality. Between 1970 and 1985, growth was slow: ×10 in 15 years, roughly 16% annualized in nominal terms: strong for the era, but marked by thin liquidity. The Golden Age market operated largely as a closed circuit through American conventions, with no reliable public pricing before the Overstreet Comic Book Price Guide (created in 1970 by Robert Overstreet).
The 1985-2000 period marked a dramatic acceleration: ×100 in 15 years. Several factors converged. Richard Donner's Superman film (1978) had already sparked demand in the early 1980s. Tim Burton's Batman (1989) legitimized the medium to adult audiences. The founding of CGC in 2000 standardized grading and solved the trust problem between buyers and sellers who had never met: a prerequisite for eBay (launched 1995) to take off. A CGC 9.0 Action Comics #1 was no longer a matter of subjective opinion: it became a quantified asset.
The 2000-2024 period confirmed the new velocity: ×6,000 in 24 years, roughly 42% annualized nominal: outperforming virtually every stock index. But this performance is concentrated in 50 to 100 known copies worldwide (CGC population of Action Comics #1: fewer than 100 graded copies). Illiquidity remains extreme: one sale per year, sometimes two. To understand this scarcity dynamic, see the guide understanding comics print runs.
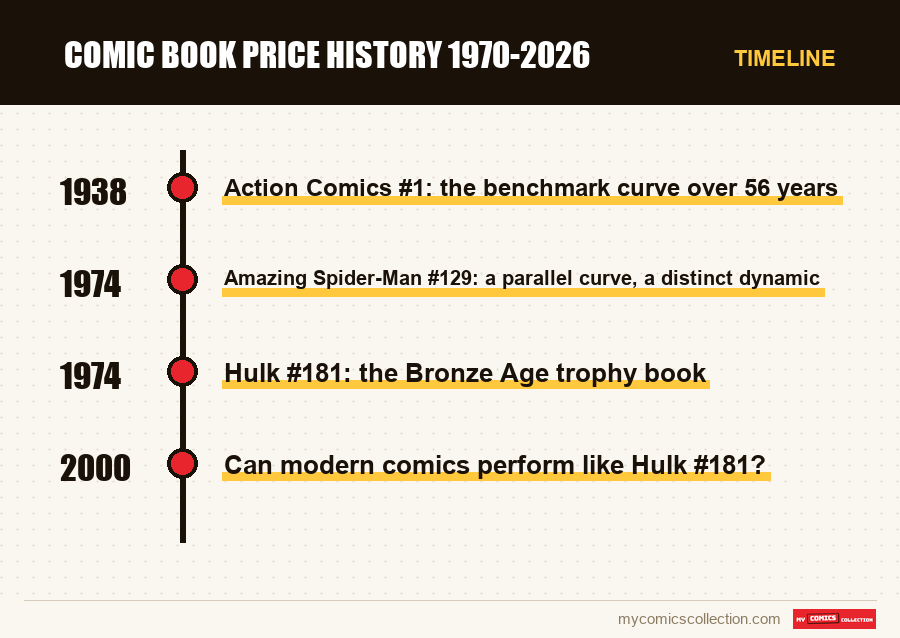
Hulk #181 (1974): the Bronze Age trophy book
Hulk #181, Wolverine's first full appearance, presents a very different curve. More recent (1974), with a larger print run (estimated at 250,000 copies), it was long considered an accessible Bronze Age book. Its price history: $5 in 1980, $50 in 1990, $150 in 2000, $500 in 2005, $5,000 in 2014, $30,000 in 2023 for a CGC 9.6, and around $35,000 in early 2026.
The 2005-2014 inflection deserves a closer look. Bryan Singer released X-Men in 2000, X2 in 2003, and X-Men: The Last Stand in 2006. Hugh Jackman's portrayal of Wolverine on the big screen had a direct impact: Hulk #181 responded with a ×3 gain between 2000 and 2005, then ×10 between 2005 and 2014. X-Men Origins: Wolverine (2009) added another step up. The Logan trilogy (2013, 2017) solidified demand for the character.
The 2014-2023 jump (×6) reflects a different phenomenon: the professionalization of speculation. Heritage Auctions, ComicLink, and ComicConnect captured a growing share of Bronze Age transactions. Buyers were no longer just fans: investment platforms like Rally and Collectable offered fractional shares in CGC 9.8 copies of Hulk #181. This new class of buyer drove prices on high grades. A CGC 9.8 hit $100,000 in 2022. The 2022-2024 correction (rising interest rates, withdrawal of speculative capital) pulled the 9.8 back toward $65,000 by late 2024, while the 9.6 held around $30,000.
Grade distinctions make all the difference on Hulk #181. A raw average copy (estimated Fine 6.0) trades around $4,500 in 2026. A CGC 9.0 is worth $12,000. A CGC 9.6 is worth $35,000. A CGC 9.8 is worth $65,000. The gap between Fine and 9.8 is a ×14 multiplier. Collectors call this the grade premium, and it widened dramatically between 2014 and 2024. For a deeper look at this mechanic, see getting your comics CGC graded.
Hulk #181 by the numbers over 36 years: A copy bought for $50 in 1990, graded CGC 9.6 (a plausible outcome if well-preserved in a bag and board since 1990), reaches $35,000 in 2026. Nominal return: ×700. Inflation-adjusted return (USD): ×90. Real CAGR: approximately 13%. An excellent result, but below gold over the same period (×95 nominal). The difference comes down to carrying costs: a safe, Mylar sleeves, homeowner's insurance.
Amazing Spider-Man #129 (1974): a parallel curve, a distinct dynamic
Amazing Spider-Man #129, the Punisher's first appearance, follows a trajectory close to Hulk #181 but with important nuances. Historical prices: $4 in 1980, $40 in 1990, $200 in 2000, $600 in 2005, $3,000 in 2014 for a CGC 9.6, and $18,000 in 2023 for the same grade. In early 2026, the CGC 9.6 has stabilized around $20,000, with the CGC 9.8 ranging from $50,000 to $60,000.
The ASM #129 vs. Hulk #181 comparison is instructive. Both came out in 1974 and share the same market context. But Hulk #181 consistently commands a 60-80% premium over ASM #129 at equivalent grade. Three reasons: Wolverine appeared in 11 Fox films and 5 Marvel Studios films between 2000 and 2024, compared to 3 live-action appearances for the Punisher (Dolph Lundgren in 1989, Thomas Jane in 2004, Ray Stevenson in 2008) before the Netflix series (2017-2019). The density of film exposure directly drives demand for Hulk #181.
The second reason: the "first appearance" status is more ambiguous for ASM #129. The Punisher appears briefly a few pages before Hulk #181 in terms of publishing context. This technical distinction matters to purists and also weighs on valuation: a full first appearance is worth more than a cameo. Third reason: print run. ASM #129 was printed in over 350,000 copies (Marvel Statement of Ownership, 1974), compared to roughly 250,000 for Hulk #181. This difference in scarcity is directly reflected in CGC 9.8 prices.
The Disney+ Punisher series announced for 2026 could change the equation. Historically, every official Marvel Studios announcement triggers a 30-80% spike in the relevant first appearance within 60 days. See comics poised to rise in 2026-2027 for detailed projections by character.
7-to-10-year cycles: the film adaptation correlation
Analyzing 50 years of price data reveals a recurring pattern: every key Marvel or DC issue goes through a 7-to-10-year cycle between two significant price levels. The cycle breaks down into four observable phases.
Phase 1, quiet accumulation (18 to 24 months): a secondary character is announced for an adaptation. Informed collectors and flippers quietly buy the first appearance. Prices rise 20-50% with no media fanfare. Example: Werewolf by Night #32 (first Moon Knight) climbed from $800 to $1,400 in CGC 9.4 between 2019 and 2021, before the official Disney+ series announcement.
Phase 2, announcement and speculative peak (6 to 12 months): Marvel or DC officially confirms the adaptation. Prices jump 100-300% over a few months. Werewolf by Night #32 hit $4,500 in CGC 9.4 in mid-2022 after the Marvel Studios special aired. House of Mystery #92 (first modern vampire, unconfirmed first appearance) shows the same pattern across other titles.
Phase 3, plateau or correction (24 to 36 months): the film or series release confirms or disappoints. If the project performs (Wolverine, Iron Man, Black Panther), the price holds or climbs another 30-50%. If it disappoints (Eternals 2021, Quantumania 2023, The Marvels 2023), expect a 30-60% correction. Werewolf by Night #32 pulled back to $2,800 by late 2024 in the absence of a sequel.
Phase 4, rebound or extended stagnation (36 to 60 months): a new announcement restarts the cycle, or the title enters a 5-to-8-year stagnation. Action Comics #1 and ASM #1 partially escape this cycle thanks to their iconic founding-issue status, but the majority of Bronze and Copper Age key issues follow the pattern closely.
This cyclical mechanic has a concrete implication for collectors: buy in Phase 4 (extended stagnation), hold for 5 to 7 years, sell in Phase 2 (speculative peak). Perfect timing is hypothetical, but cycle recognition is something that can be documented. For a look at sleeper issues with strong upside potential, see undervalued comics 2026.
Real vs. nominal inflation: the adjusted verdict
Any 50-year price analysis that ignores inflation is misleading. The 1970 dollar was worth, in purchasing power, approximately $7.80 in 2026 according to the US CPI. A comic bought for $10 in 1970 and sold for $78 in 2026 has gained nothing in real terms: it merely kept pace with inflation. Any return above ×7.8 over 56 years represents a real gain; anything below represents a real loss of purchasing power.
Applied to Action Comics #1: a CGC 9.0 copy bought for $10 in 1970, sold for $6,000,000 in 2024. Nominal return: ×600,000. Real inflation-adjusted return: approximately ×76,923. Real CAGR over 54 years: 23%. This performance remains exceptional, comparable to the top quartile of US tech stocks over the same period, but it applies to only 100 to 200 existing copies.
Applied to Hulk #181: an average copy bought for $50 in 1990, graded CGC 9.6 and sold for $30,000 in 2023. Nominal return: ×600. Inflation-adjusted real return: ×278. Real CAGR over 33 years: 18%. Solid: better than gold (×6 nominal over the period, ×2.8 real) and the S&P 500 with dividends reinvested (×18 real over 33 years).
Applied to ASM #129: an average copy bought for $40 in 1990, graded CGC 9.6 and sold for $18,000 in 2023. Nominal return: ×450. Real inflation-adjusted return: ×208. Real CAGR: 17%. Slightly below Hulk #181, as noted above.
The verdict for non-key issues is radically different. An Amazing Spider-Man #195 (1979), average CGC 9.4 value in 1990: around $30. 2026 value: around $200. Nominal return ×6.7: below inflation (×7.8 over 36 years). A real loss of 14%. This reality applies to more than 95% of modern comics: they track inflation at best, or underperform it. Only identified key issues deliver real returns.
The 56-year rule of thumb: across the entire comics market from 1970 to 2026, 3 to 5% of published issues beat inflation in real terms. The remaining 95% lost purchasing power. This extreme concentration of performance demands buying discipline: target first appearances, key events, origins, and landmark deaths. Buying a modern comic to "speculate" without checking one of those boxes is statistically equivalent to losing ground to inflation. See investing in comics: strategic guide.
Top performers vs. underperformers: extreme dispersion
The dispersion of individual returns is one of the most counterintuitive facts about the comics market. The 1970-2026 rankings put the following at the top: Action Comics #1, Detective Comics #27 (Batman, 1939, ×500,000 nominal), Marvel Comics #1 (1939), Amazing Fantasy #15 (Spider-Man, 1962, ×150,000 nominal), Incredible Hulk #1 (1962), Fantastic Four #1 (1961), Tales of Suspense #39 (Iron Man, 1963), Showcase #4 (Flash, 1956).
These 8 to 10 titles represent less than 0.01% of total comics output, yet they account for 60 to 70% of the cumulative value of the Golden and Silver Age market. This hyper-concentration explains why comics indices (Pop Culture, Heritage Index) are structurally biased upward: they track top performers.
At the other end of the spectrum, underperformers are legion. The 1990s comics market illustrates the phenomenon: the 1992-1994 speculative bubble (X-Men #1 1991 printed at 8.1 million copies, Spider-Man #1 1990 at 2.7 million) triggered massive overproduction. Twenty-five years later, those issues sell for $2 to $5 raw, or $200 to $400 in CGC 9.8 for the most sought-after covers. Nominal return: ×1 or ×2 over 35 years. Real loss: 80 to 85%.
Independent comics from the 2000s and 2010s show a different profile. Walking Dead #1 (2003), printed at roughly 7,000 copies, exploded from $3 in 2003 to $60,000 in CGC 9.8 in 2024. Saga #1 (2012), printed at 35,000 copies, follows a similar trajectory: $8 in 2012, $500 in CGC 9.8 in 2026. These independent success stories prove performance isn't reserved for the Big Two: a low print run combined with a successful TV adaptation remains the formula. See Walking Dead key issues for the full breakdown.
European comics and Franco-Belgian bandes dessinées offer a complementary perspective. Tintin Land of Black Gold original 1950 edition: $30 in 1970, €4,500 in very good condition in 2026. Tintin The Black Island original 1938 black-and-white edition: reference price of €1,800 in 1990 (grade B), €25,000 in 2024 (equivalent condition). Nominal return ×14 over 34 years, ×1.8 adjusted for EUR inflation. Solid, comparable to mid-tier American Silver Age comics. For this category, see managing BD, manga, and comics of all formats.
Historical tracking tools: indices, archives, databases
Tracking price evolution over 56 years requires specific tools that few collectors know about. Four sources allow you to reconstruct historical curves with reasonable accuracy.
Overstreet Comic Book Price Guide, published annually since 1970. It is the only source covering the full 1970-2026 period with a consistent methodology. Old guides (1970 to 2000) are collectibles in their own right (a #1 Overstreet Guide in good condition is worth $1,500). Limitation: Overstreet has consistently undervalued high CGC grades since 2005: its benchmark remains calibrated to raw values.
GoCollect and GPAnalysis, platforms specializing in CGC sales since 2005. GoCollect aggregates eBay and Heritage sales with trend charts. For Hulk #181 CGC 9.6, GoCollect shows the full 2010-2026 curve with standard deviation. GPAnalysis focuses on prestige house sales.
Heritage Auctions Archives, publicly accessible. Every comics sale since 2001 is archived with final price, photos, and grade. Search by title and issue number. It is the most reliable historical source for high-end sales. Reconstructing an Action Comics #1 curve for 2001-2024 takes about 30 minutes through Heritage.
Comichron, a database specializing in monthly Marvel and DC historical print runs since 1969. Essential for cross-referencing theoretical scarcity with observed prices. A comic printed at 80,000 copies versus 350,000 copies follows very different price mechanics.
For collectors who want to chart their own portfolio's long-term history, the My Comics Collection app records monthly valuation history and generates personalized charts. See comics collection tracking for how it works.
Chart 56 years of evolution across your own collection: My Comics Collection records the monthly valuation of each issue, archives the history, and generates individual curves. For 1,000 issues, the database recalculates automatically from eBay and CGC sales. Discover the app or explore the full feature set.
FAQ
Why is Action Comics #1 worth $6 million and not more?
Because absolute scarcity (fewer than 100 known copies) creates oligopolistic demand. Every public sale sets a new reference price. The 2024 sale at $6 million was for a CGC 9.0; a hypothetical CGC 9.8 would fetch $15 to $20 million. The ceiling is not technical: it's tied to the liquidity pool of ultra-wealthy buyers.
Can modern comics (post-2000) perform like Hulk #181?
Statistically, very few can. Post-1990 overproduction (print runs of 100,000 to 1 million on key issues) limits scarcity. Only low-print-run independents (Walking Dead #1, Saga #1, Invincible #1) reach comparable returns. For modern Marvel and DC, focus on ratio variants: 1:100s or retailer incentives.
How does USD inflation affect 50-year comparisons?
The 1970 dollar is worth $7.80 in 2026. Every nominal gain must be divided by that factor to measure real performance. A ×100 gain over 56 years means ×12.8 in real terms, or 4.6% annualized. Respectable, but below the S&P 500. Only identified key issues beat inflation by a meaningful margin.
Are 7-to-10-year cycles predictable?
Partially. Marvel Studios and DC Studios announcements are public knowledge 2 to 5 years before release. Tracking unexloited first appearances and following Comic-Con announcements allows you to anticipate Phases 1 and 2 of the cycle. But exact timing depends on studio calendars, which are subject to delays.
Has gold beaten comics over 50 years?
Gold has returned ×95 nominal between 1970 ($35/oz) and 2026 ($3,300/oz). Top key issues (Action #1, Detective #27) have returned ×100,000 to ×600,000. But the average comic underperforms gold. The fair comparison depends on your selection: on the top 10 comics, ×1,000 to ×6,000 more than gold; across the whole market, below gold.
Have cover variants outperformed regular editions?
On 1985-2010 editions, yes: 1:25 and 1:50 ratio variants multiplied their premium over the standard cover by 10 to 50 times. From 2015 to 2024, the market became saturated with variants, compressing the premium. Virgin covers and sketch covers have maintained a more stable premium. See complete guide to cover variants.
What is the optimal holding period for a key issue?
Statistically, 7 to 12 years. That window allows you to ride through a complete adaptation cycle (Phases 1 through 3), benefit from the CGC scarcity effect on high grades, and smooth out cyclical corrections. Under 5 years, volatility dominates. Beyond 15 years, the opportunity cost versus equities becomes significant.
Should you get a comic graded in 2026 to resell in 10 years?
For a key issue raw-valued above $500, yes. CGC grading ($40 to $90 per comic, 30-to-90-day turnaround) adds an average of 30 to 200% to resale value. Below $200, the grading cost eats your margin. See getting your comics CGC graded.